Computational throughput is important for simulation scalability. Thus, in the
following experiment, we measured the performance of each of the simulation
engines in performing a tight simulation event loop. We began the simulations
at time zero, with an event scheduled to generate another identical event for
the subsequent simulation time step. We ran each simulation for ![]() simulation
time quanta, over a wide range of
simulation
time quanta, over a wide range of ![]() and measured the actual time elapsed.
and measured the actual time elapsed.
Equivalent, efficient benchmark programs were written in each of the systems. The JiST program looks similar to the ``hello world'' program presented earlier. The Parsec program sends null messages among native Parsec entities using the special send and receive statements. The GloMoSim test considers the overhead of the node aggregation mechanism built over Parsec, which was developed to reduce the number of entities and save memory for scalability (discussed shortly). The GloMoSim test is implemented as an application component, that circumvents the node communication stack. Both the Parsec and GloMoSim tests are compiled using using pcc -O3, which is the most optimized setting. ns2 utilizes a split object model, allowing method invocations from either C or Tcl. The majority of the performance critical code, such as packet handling, is written in C, leaving mostly configuration operations for Tcl. However, there remain some important components, such as the mobility model, that depend on Tcl along the critical path. Consequently, we ran two tests: the ns2-C and ns2-Tcl tests correspond to events scheduled from either of the languages. ns2 performance lies somewhere between these two, widely divergent values, depending on how frequently each language is employed for a given simulation. Finally, we developed a baseline test to obtain a lower bound on the computation. It is a program, written in C and compiled with gcc -O3, that inserts and removes elements from an efficient implementation of an array-based heap.
|
The results are plotted in Figure 16. Please note the
log-log scale of this and subsequent plots. As expected, all the
simulations run in time linear with respect to ![]() . An unexpected result,
since Java is interpreted, is that JiST out-performs all the other systems,
including the compiled ones. It also comes within 20% of the baseline measure
of the lower bound. This is due to the impressive JIT dynamic compilation and
optimization capabilities of the modern Java runtime. The optimizations can
actually be seen as a kink in the JiST curve during the first fraction of a
second of simulation. To confirm this, we warmed the JiST test with
. An unexpected result,
since Java is interpreted, is that JiST out-performs all the other systems,
including the compiled ones. It also comes within 20% of the baseline measure
of the lower bound. This is due to the impressive JIT dynamic compilation and
optimization capabilities of the modern Java runtime. The optimizations can
actually be seen as a kink in the JiST curve during the first fraction of a
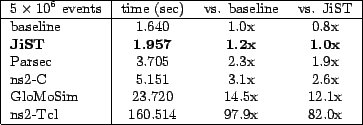
second of simulation. To confirm this, we warmed the JiST test with ![]() events and observed that the kink disappears. The table shows the time taken
to perform 5 million events in each of the measured simulation systems and
these figures normalized against the baseline and the performance of JiST.
JiST is twice as fast as both Parsec and ns2-C. GloMoSim and ns2-Tcl are one
and two orders of magnitude slower, respectively.
events and observed that the kink disappears. The table shows the time taken
to perform 5 million events in each of the measured simulation systems and
these figures normalized against the baseline and the performance of JiST.
JiST is twice as fast as both Parsec and ns2-C. GloMoSim and ns2-Tcl are one
and two orders of magnitude slower, respectively.
![\includegraphics[width=\columnwidth,keepaspectratio]{include/events}](img26.png)